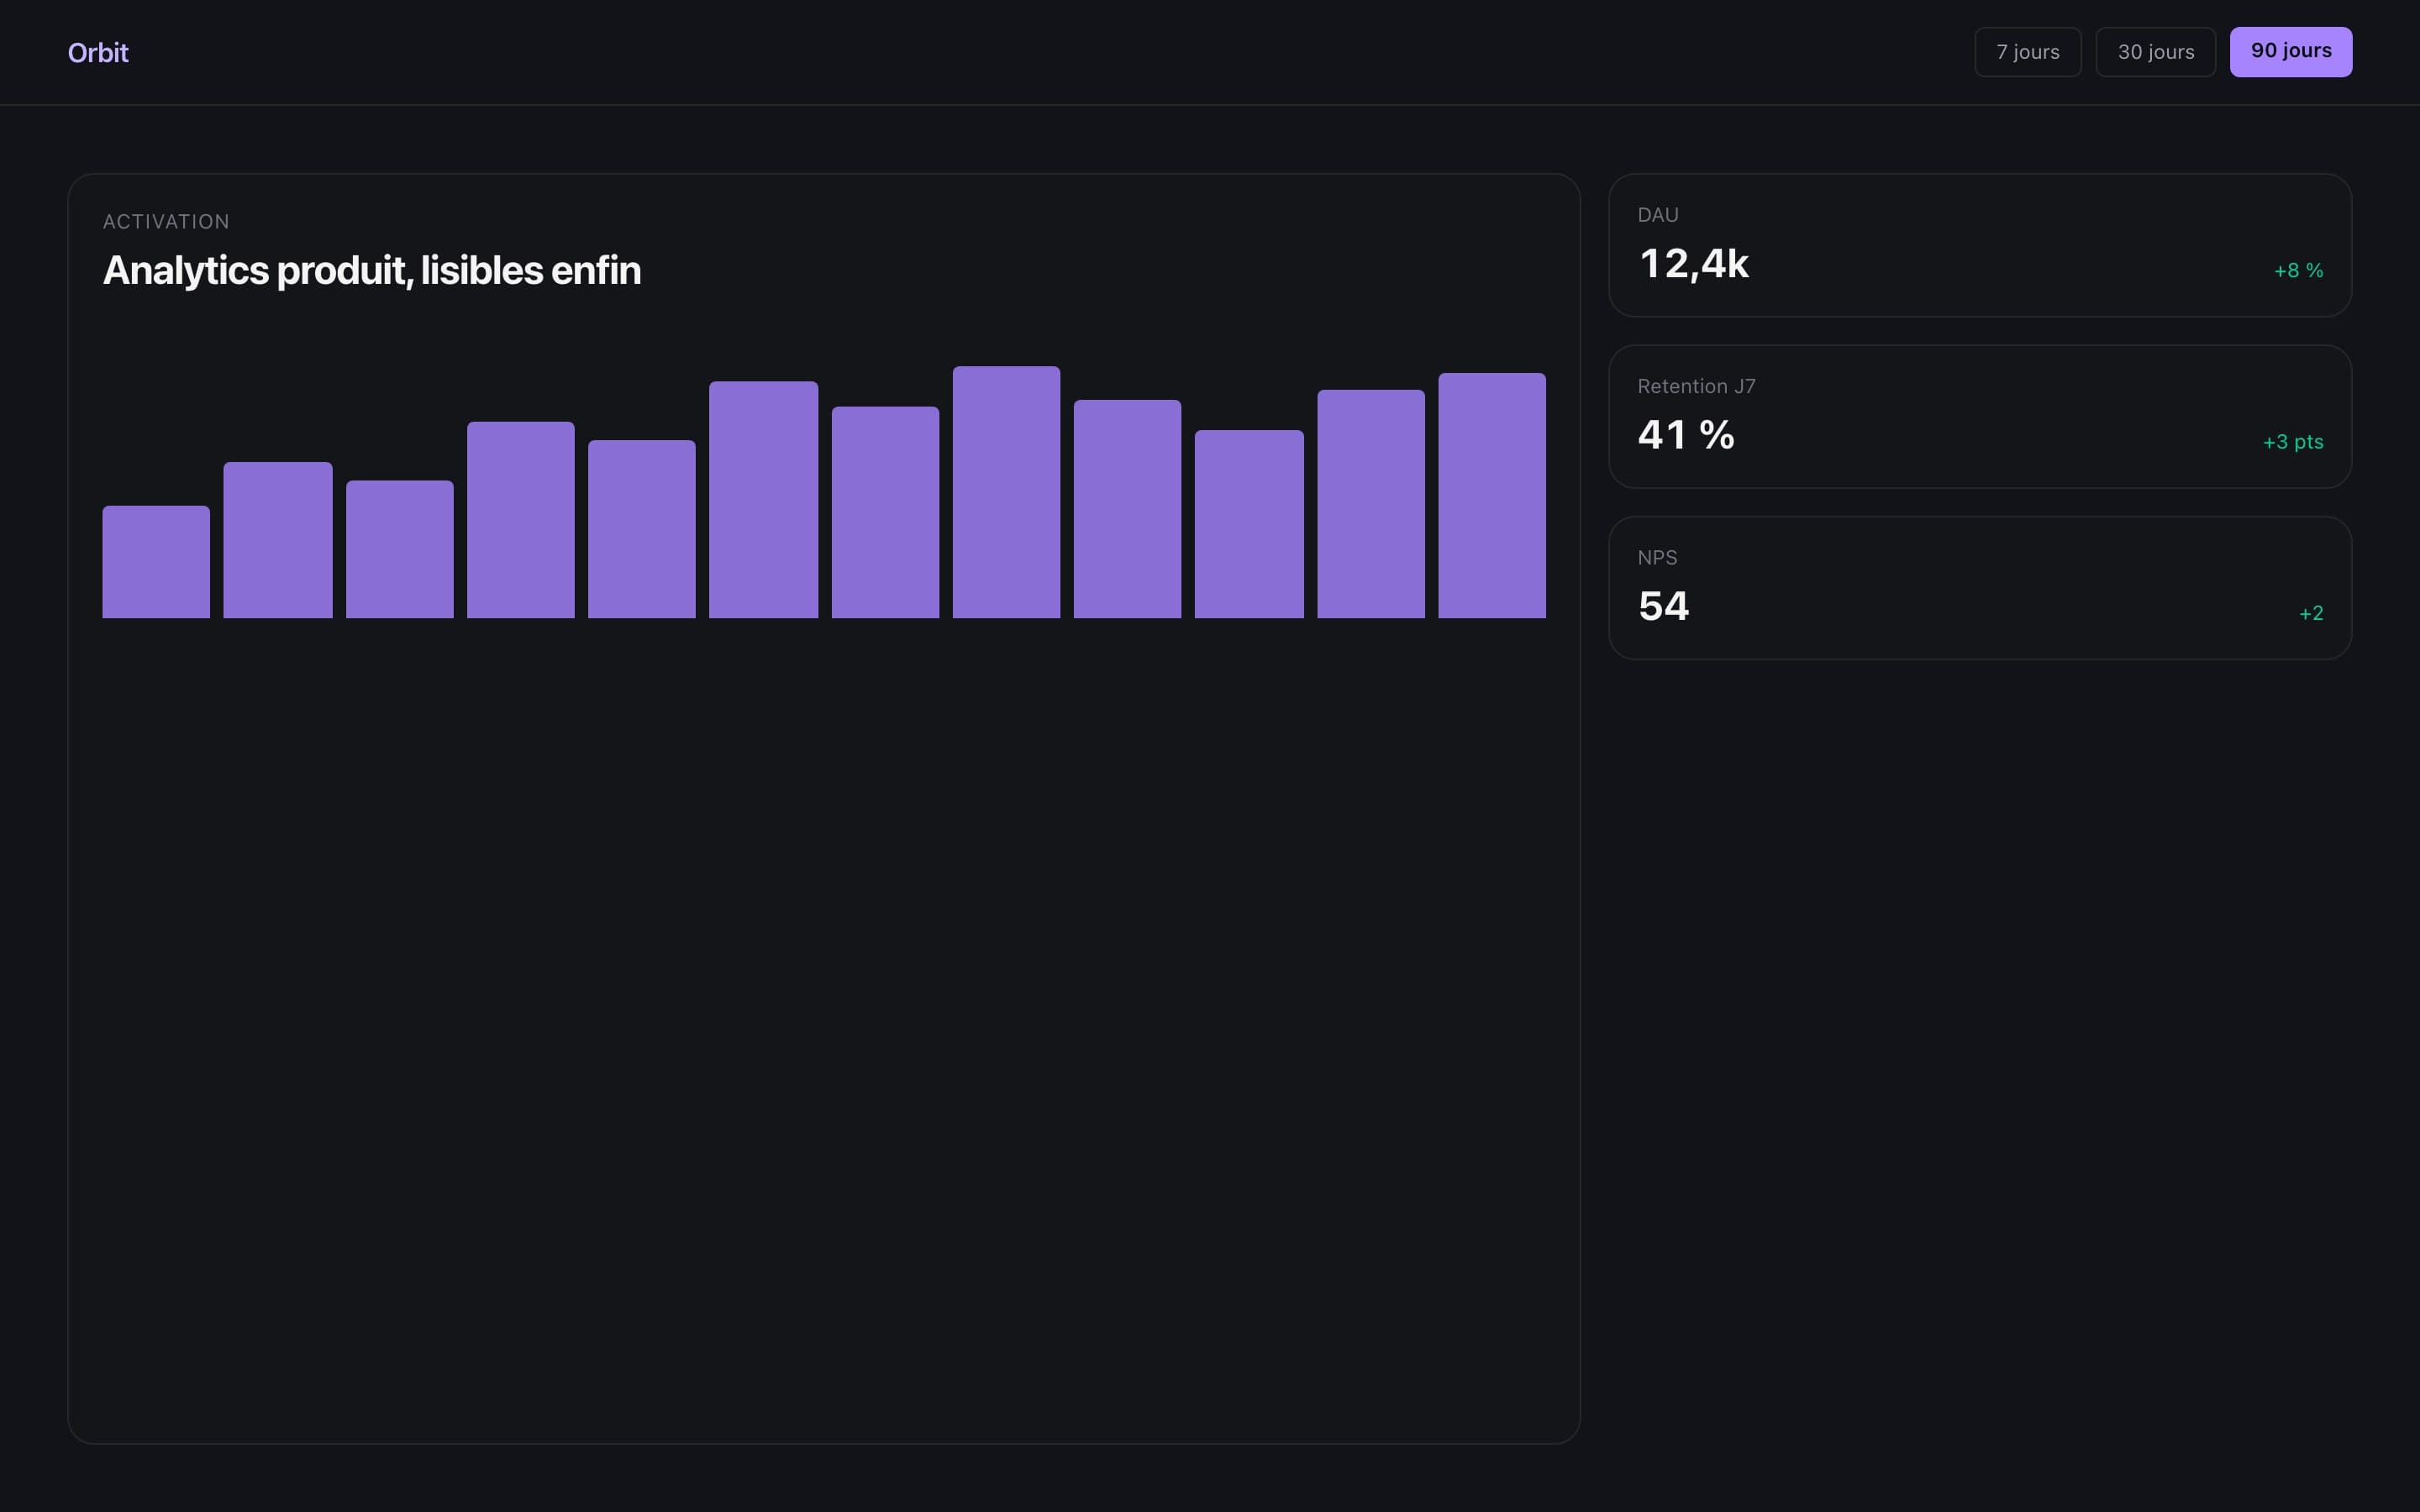
Product analytics · Dashboards
Orbit
Product analytics, finally readable
Scroll to explore ↓
01 · Product analytics
Metrics you actually read
Product analytics, finally readable. Fictional direction — same craft as real client work under NDA.
- 01
Funnels
Activation → retention, without Sunday SQL.
- 02
Cohorts
Who stays, who leaves, week after week.
- 03
Events
Clean tracking, consistent names, docs built in.
01b · Engineering
Technical sheet
Stack, shipping and my role on this build — for recruiters and tech leads.
- Technologies
- Next.js
- TypeScript
- React
- Tailwind CSS
- Libraries & tools
- Recharts-style charts
- Framer Motion
- Deployment
/play demo — simulated ops app, mock data
- Role
Data UX · dense UI · business components
- Context
Playable prototype — filters, states, navigation
02 · Inside the product
One scroll, one screen
Each section locks to the viewport — keep scrolling past the last screen to return to the brief.
Metrics you actually read
OpenFunnels
128 k€
Cohorts
98,2 %
Events
14
Cohorts
OpenOpen Orbit
OpenSélection
Product analytics, finally readable
Fictional ecommerce dataset already wired.
Activité
We killed a feature nobody used — thanks to cohorts.
CPO
Board-ready dashboard in 10 minutes.
Growth
Back to the brief
You’ve left the demo screens — next: try it, then the craft notes.
03 · Product
Clearer decisions
“We killed a feature nobody used — thanks to cohorts.”
“Board-ready dashboard in 10 minutes.”
04 · Sandbox
Open Orbit
Fictional ecommerce dataset already wired.
- →Hero + below-the-fold sections (not just a hook)
- →Visual hierarchy and primary CTA
- →Information density vs readability
Local demo — no data is sent.
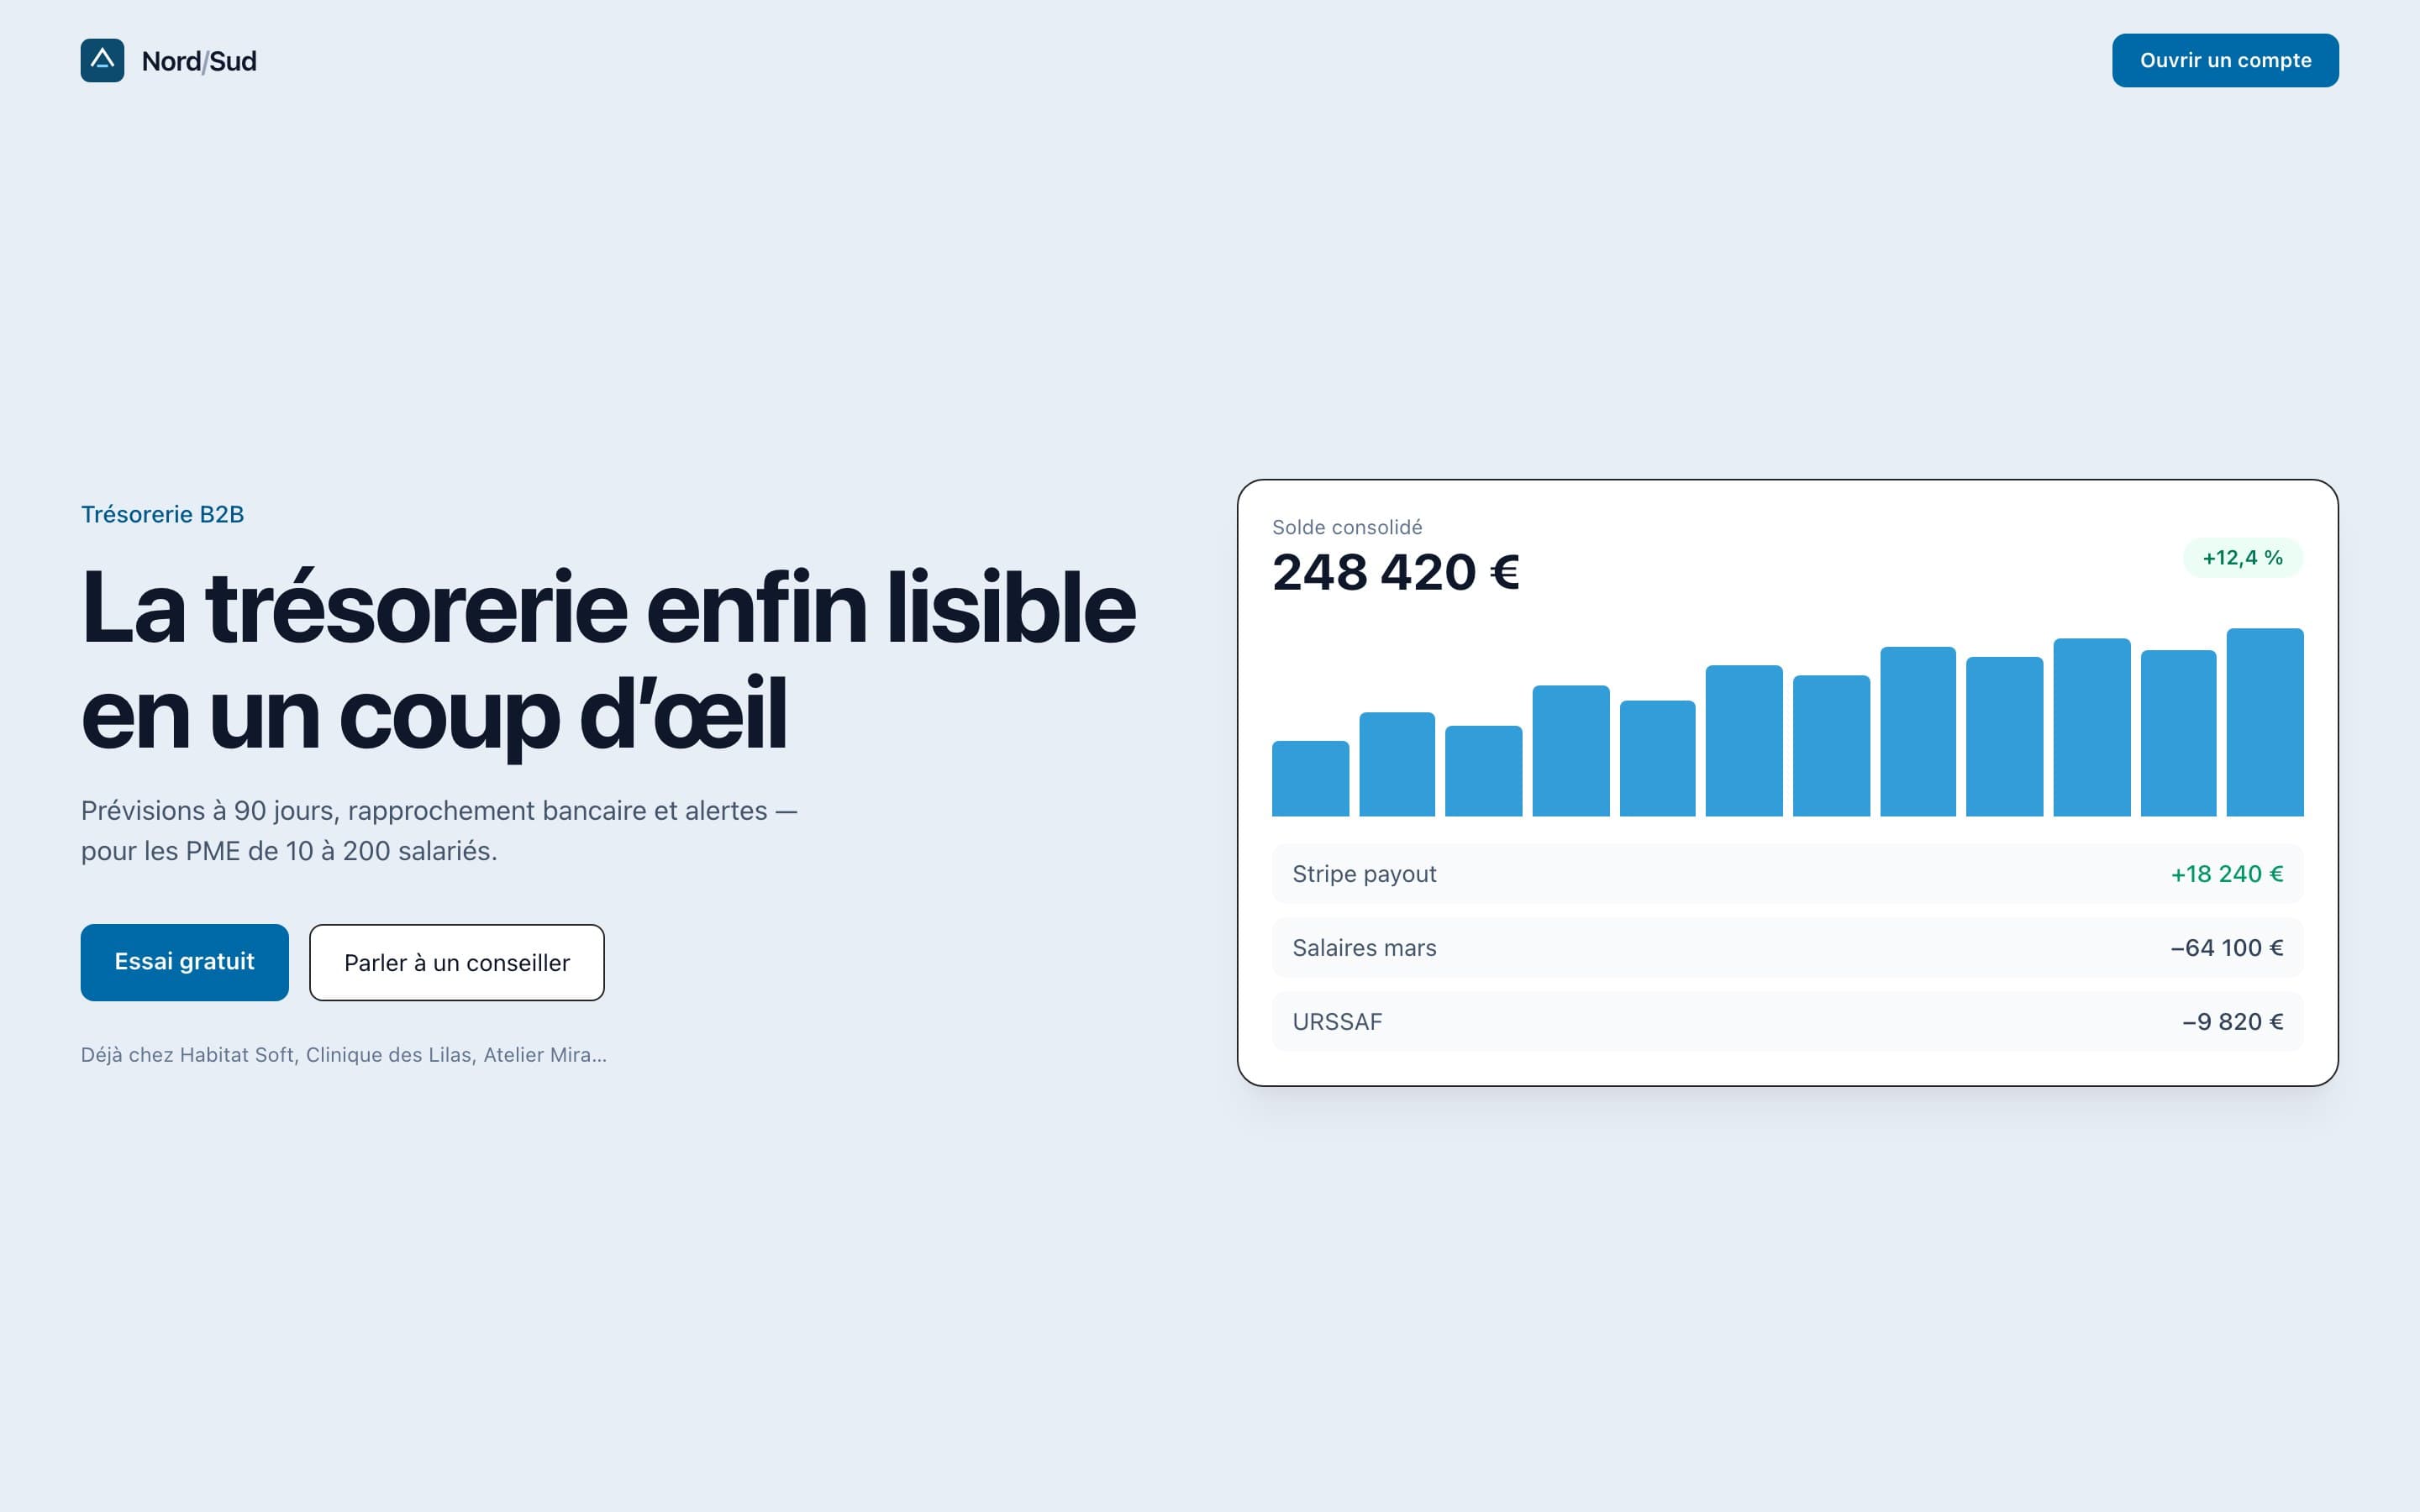
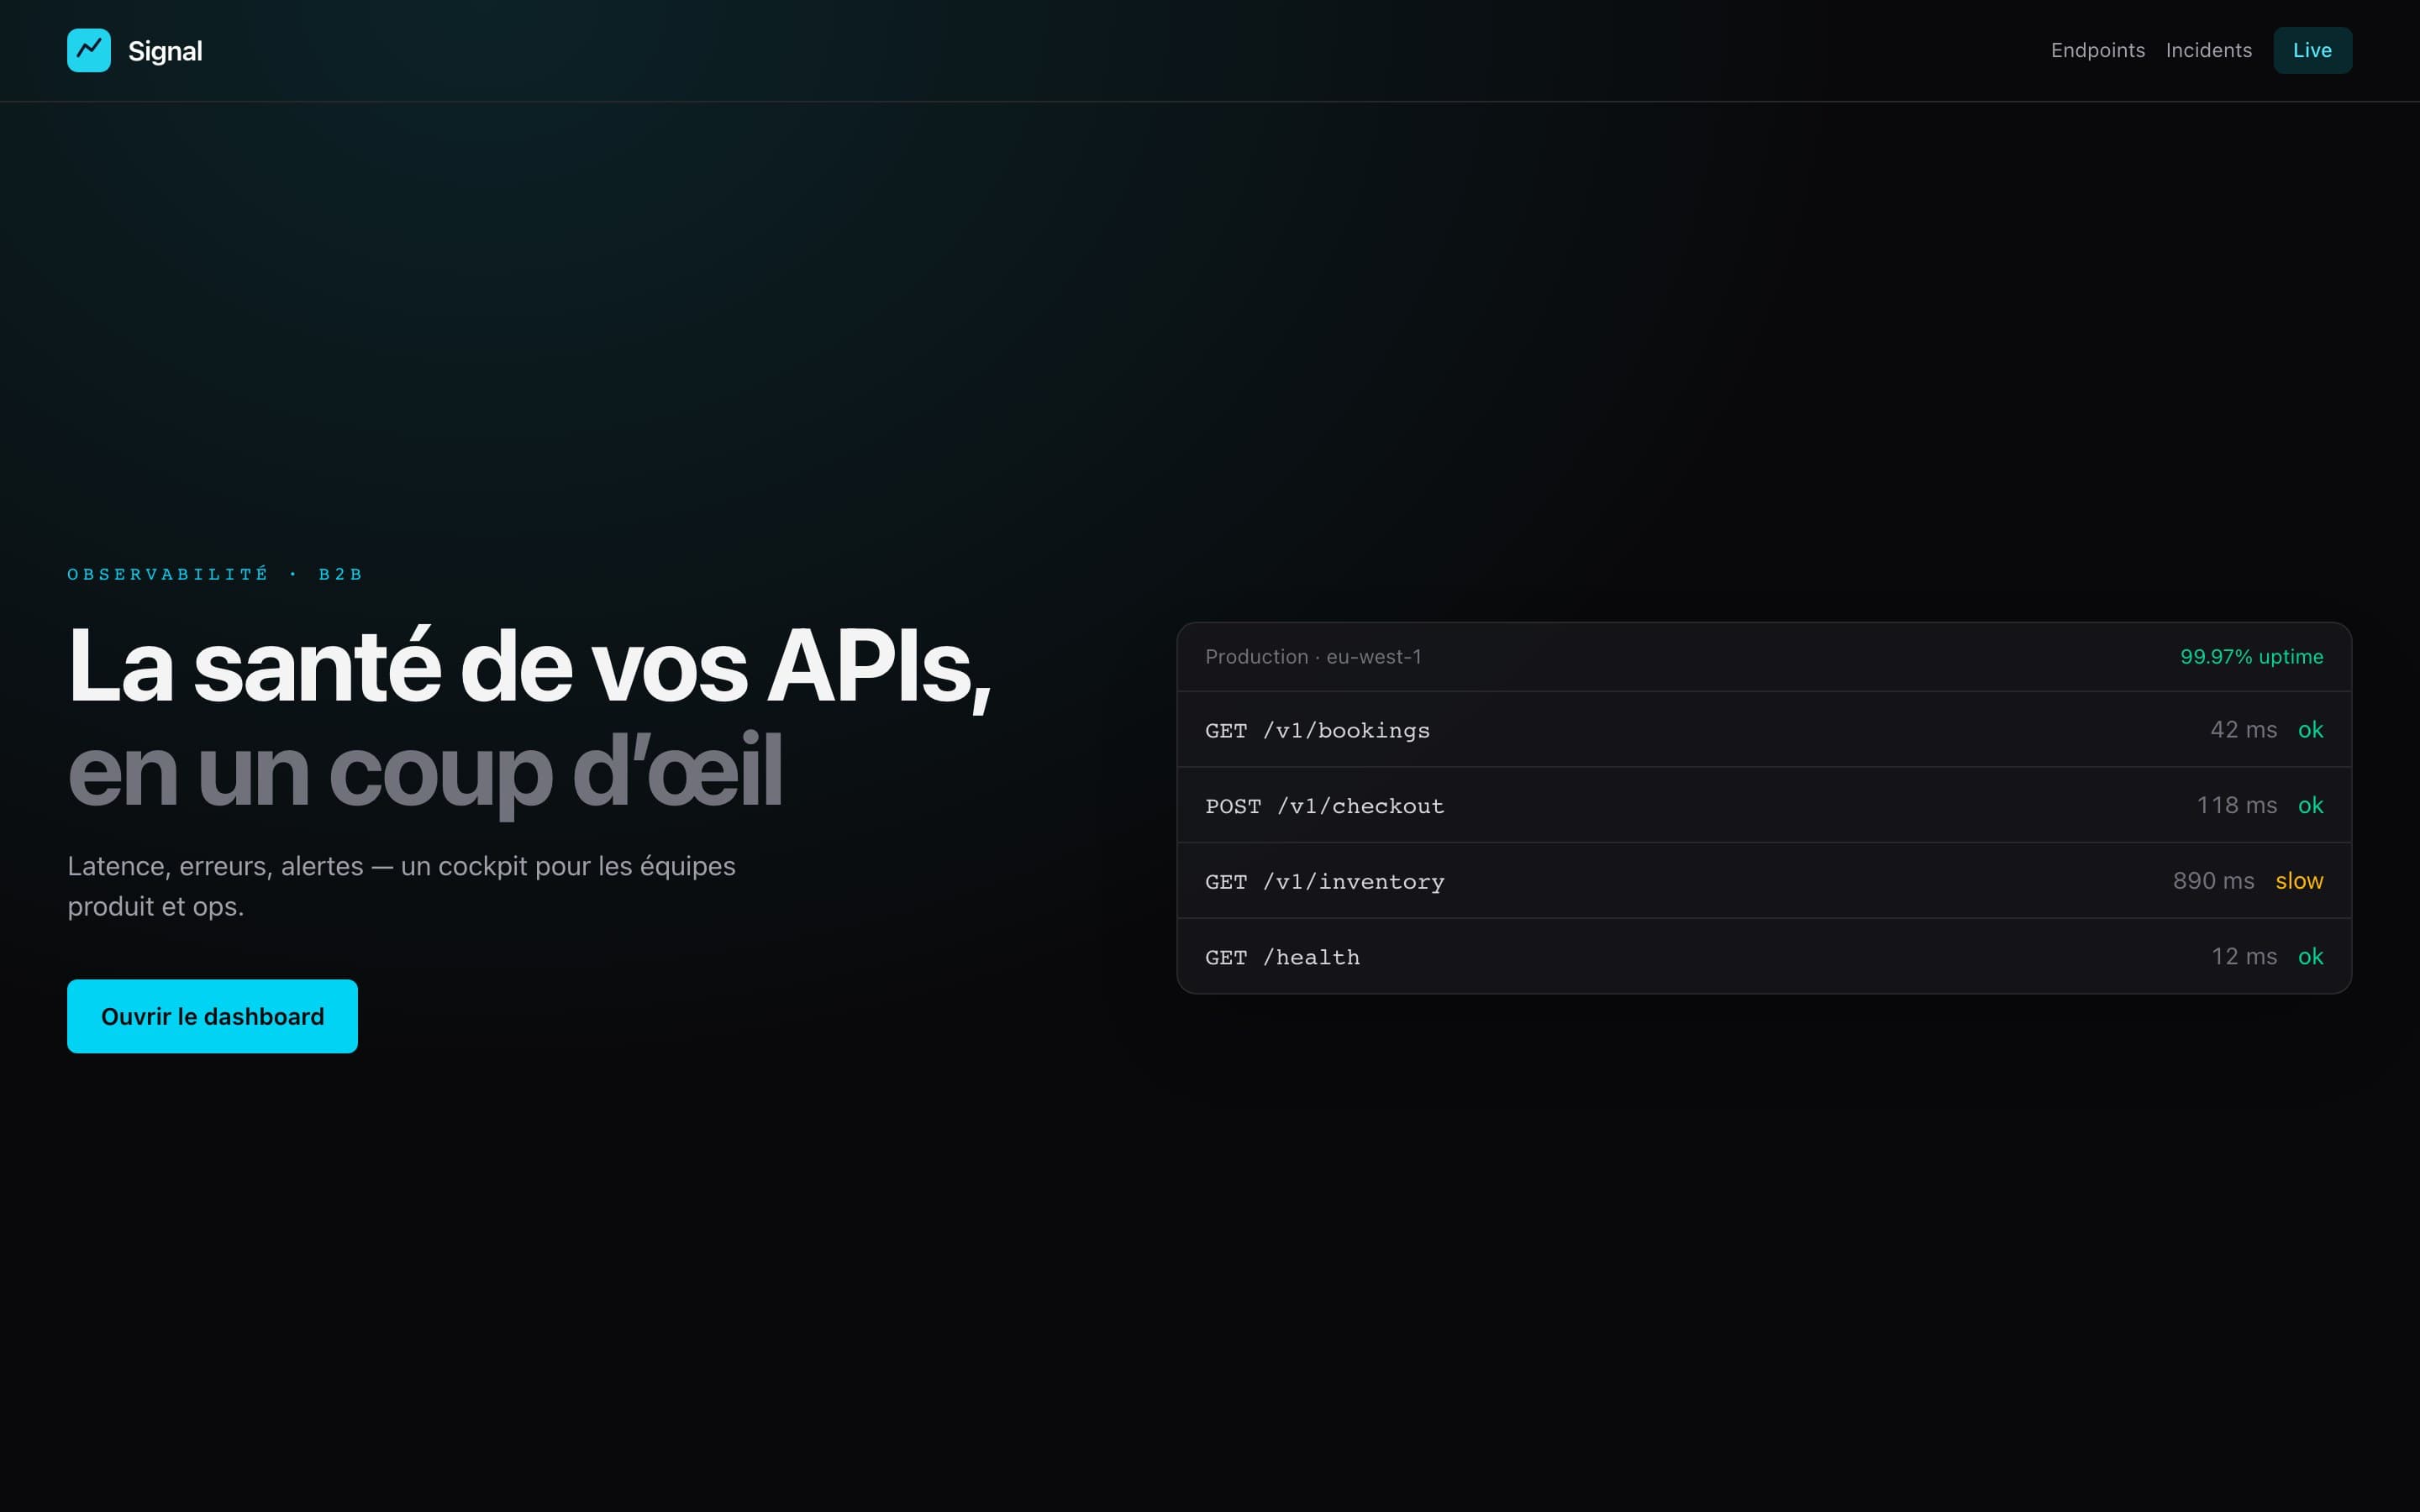
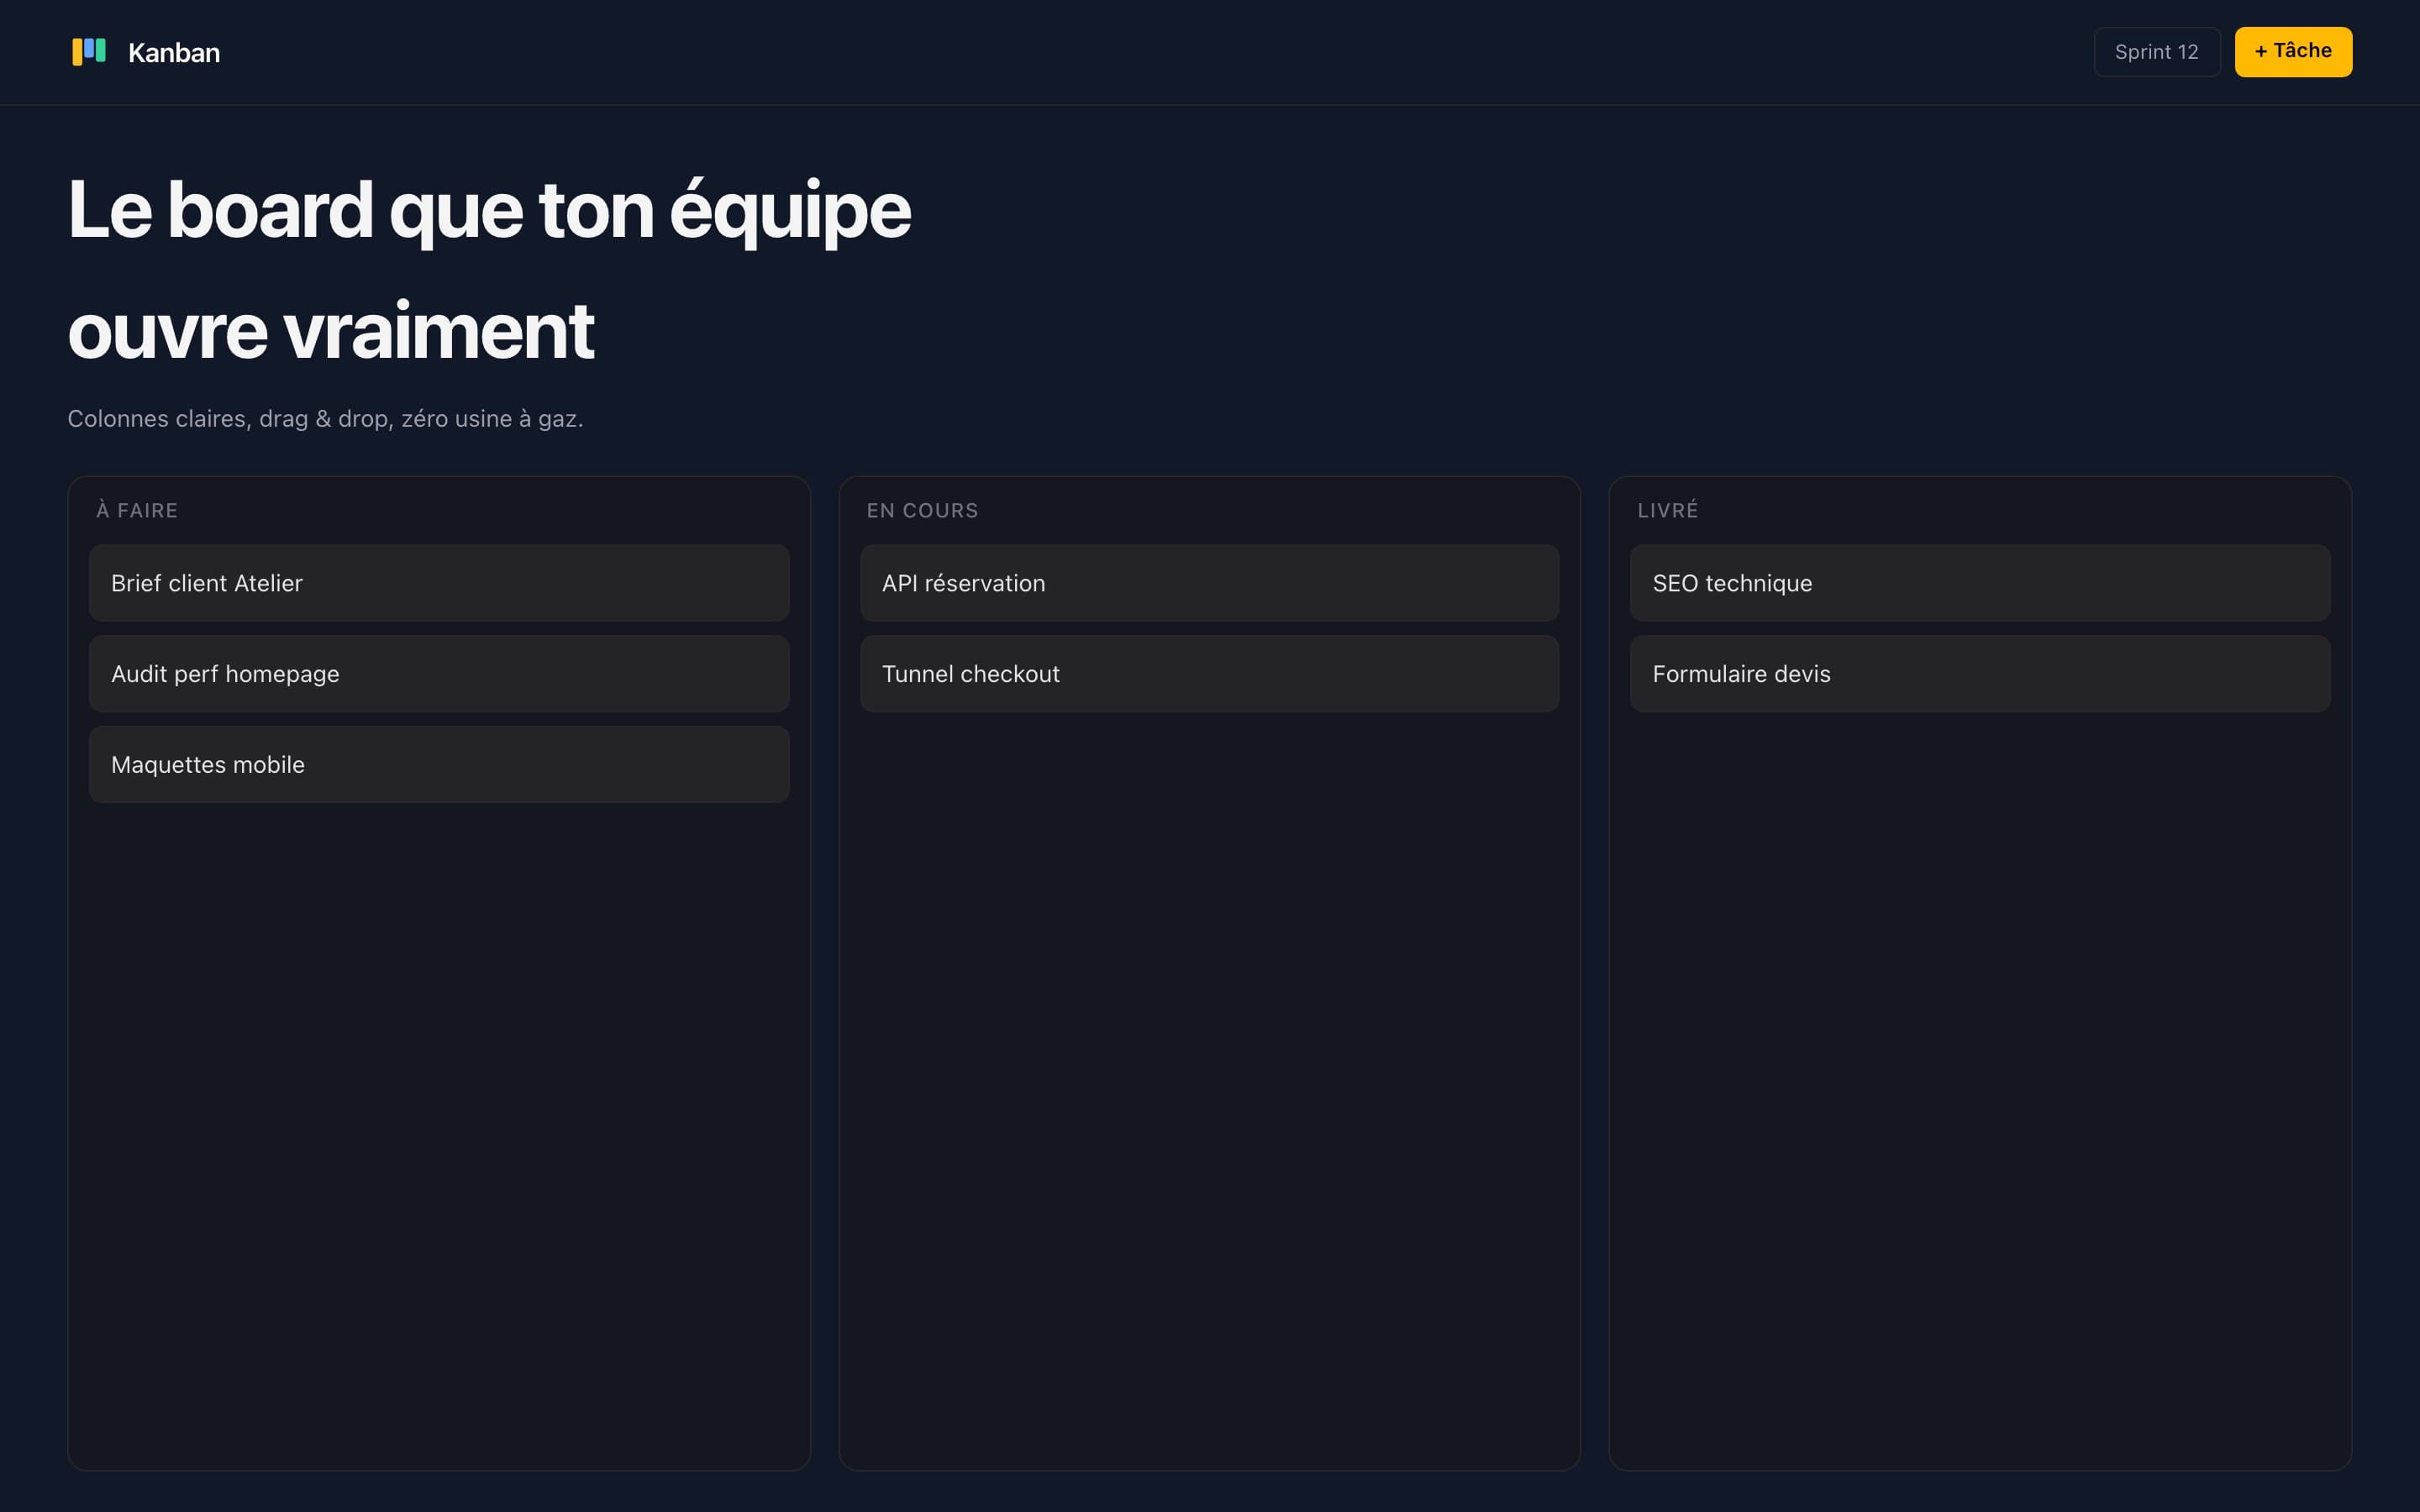
05 · Same family
Other directions of the same type — to compare density and mood.
06 · What to look at
- 01Hero + below-the-fold sections (not just a hook)
- 02Visual hierarchy and primary CTA
- 03Information density vs readability
- 04Interactive states (hover, selection, feedback)